ash Ribbon Signal: is $BTC finally moving from capitulation to accumulation? “When miners give up, it is possibly the most powerful BTC buy signal ever” – Charles Edwards, Creator of the Hash Ribbon Indicator.
Hash Ribbon Signal: Is BTC Moving From Capitulation To Accumulation?
Aleisha Lee • March 1, 2026

Aleisha Lee, CPA, Licensed Real Estate Agent (Queensland)
1 March 2026 < 2 minutes read
After $BTC rallied to $126k in October 2025, it suffered an aggressive 50%+ drawdown, falling below the key psychological level of $60k at one point in early February. This decline coincided with the 30DMA Hash Rate crossing below 60DMA Hash Rate – a classic sign of miner stress. When this occurs, it suggests mining revenues are no longer sufficient to cover operational costs, forcing less efficient miners to shut down their mining rigs and liquidate their BTC reserves. The result is a wave of intense selling pressure, contributing to the recent billion-dollar liquidation in leveraged long positions.
Now, the Hash Ribbon Indicator is finally flashing a signal that may mark the
end of a 3-month miner capitulation – one of the longest Bitcoin winters in history, according to data from
Glassnode.
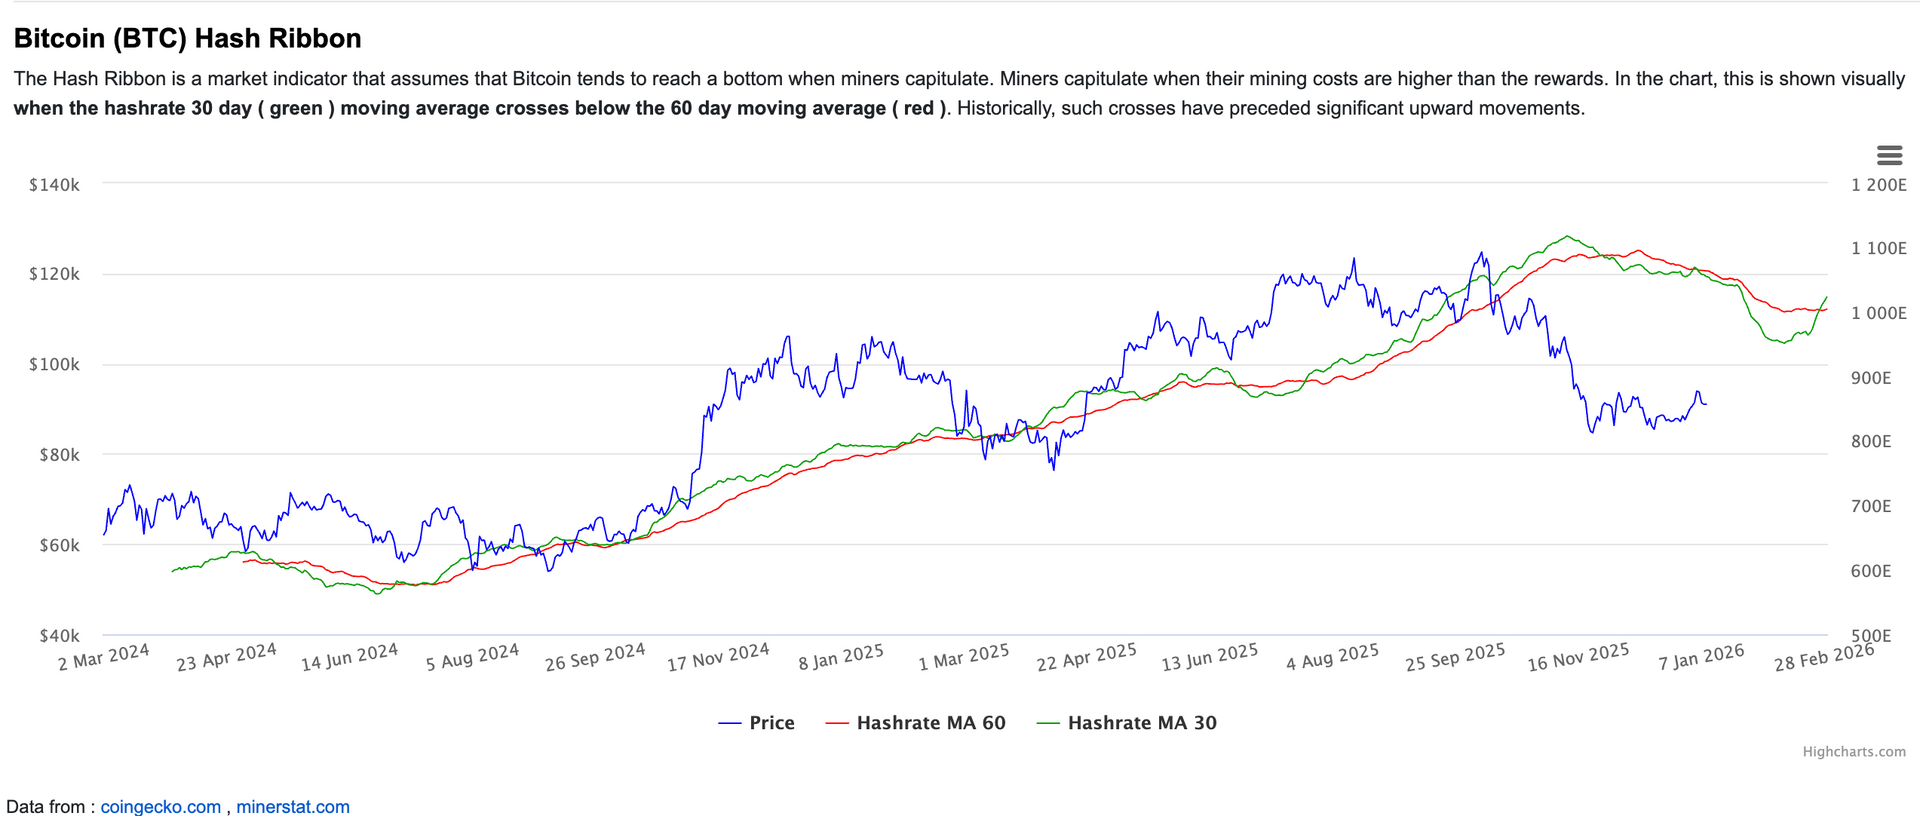
Source: CoinGecko.com
This raises the question: is BTC forming a structural bottom and its recovery is on the way?
It may be too early to tell. If the miner capitulation persists and $BTC fails to reclaim the production cost level quickly, financial stress could trigger another round of miner capitulation selling. From a technical standpoint, the broader trend – both weekly and monthly charts remain bearish. The recent rally could be just a bull trap, with price potentially retesting the $60k key psychological support level.
Source: Bloomberg
On the flip side, the curl up in Hash Rate suggests the
30DMA may soon cross back above the 60DMA –
a reliable metric for spotting a macro bottom. At the time of writing this post, reports have confirmed that the joint US-Israel strike has taken out the Supreme Leader of Iran, and this conflict is injecting
fresh geopolitical volatility into the global markets. On the back of the news, crypto market is rebounding from yesterday’s lows, with $BTC hovering around $67k, trading just slightly below its average production cost of approximately $68k (data from 99bitcoins). This level is commonly referred to as the
‘deep value zone’. The last time this setup occurred was in November 2022, when BTC bottomed near $15,500 before starting a sustained recovery. If history repeats, the market may be approaching a recovery crossover – signalling selling exhaustion and potentially allowing renewed demand to drive $BTC higher again.
Key Takeaways
While broader trends remain bearish and risks persist, the Hash Ribbon Indicator combined with $BTC hovering near the deep value zone suggests we may be approaching a macro bottom. Miner capitulation appears to be easing, selling pressure is subsiding, and this could represent a window of opportunity to position for the next potential phase of $BTC accumulation.
Disclaimer
This article is for general informational purposes only. I give no warranty and accept no responsibility or liability for the accuracy or the completeness of the information and materials contained in this article and on this website. Under no circumstances will I be held responsible or liable in any way for any claims, damages, losses, expenses, costs or liabilities whatsoever (including, without limitation, any direct or indirect damages for loss of profits, business interruption or loss of information) resulting or arising directly or indirectly from your use of or inability to use this website or any websites linked to it, or from your reliance on the information and material in this article and on this website. NOTHING ON THIS WEBSITE IS FINANCIAL ADVICE.

While Wall Street was busy hitting records, the other Great Wall Street was quietly doing the same. What the Biggest Capital Rotation of 2026 Means For Global Markets and Digital Assets.
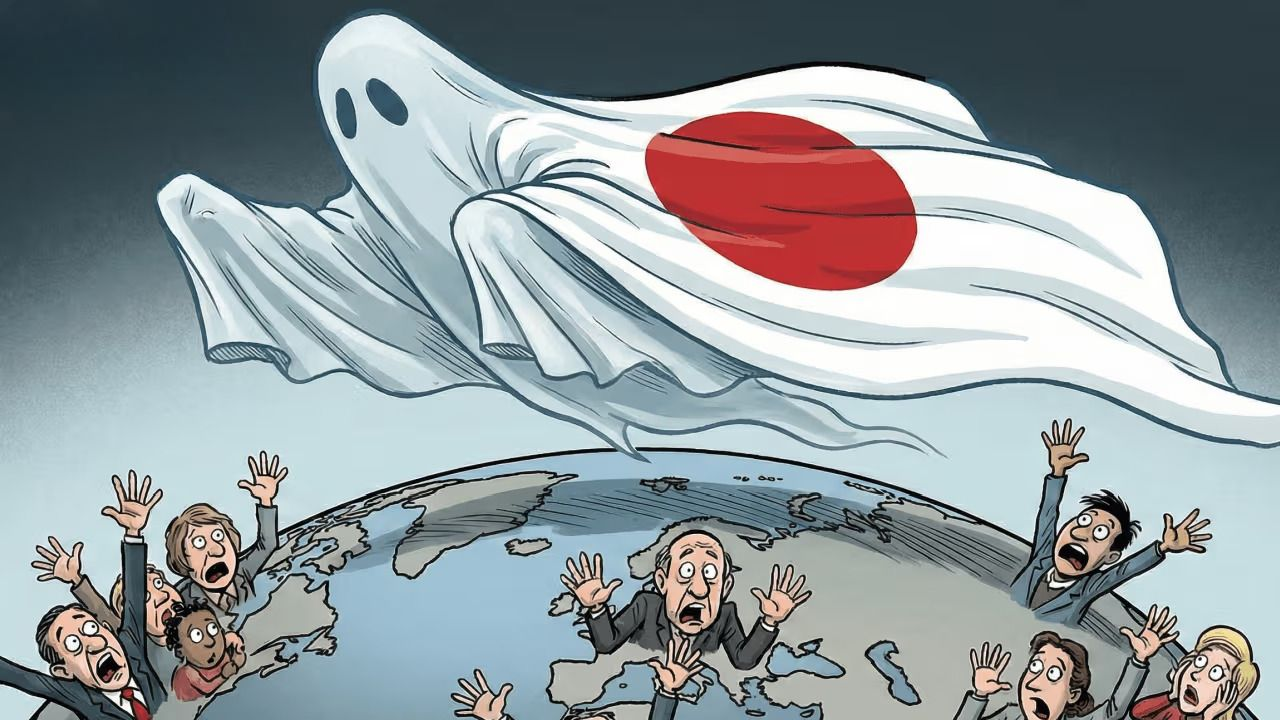
While global markets fixate on the Strait of Hormuz and the Fed, one of the most consequential financial events of 2026 is quietly building in Tokyo. BOJ is actively transitioning away from decades of ultra-loose monetary policy and the ripple effects are already being felt across global financial markets.
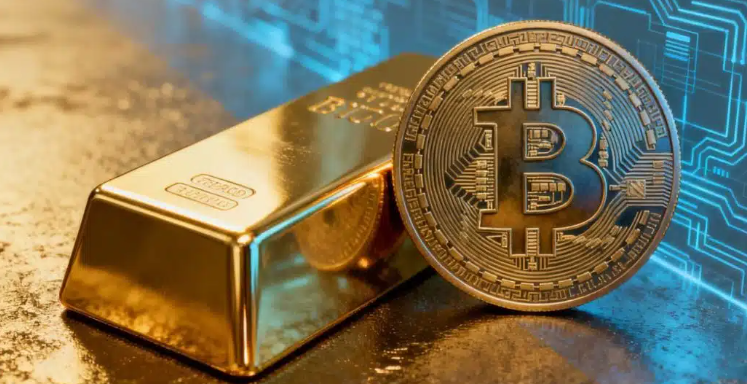
Recent price movements illustrate gold’s resilience and BTC’s failure as a hedge. While gold has rallied through macro and geopolitical headwinds — tariffs, the Iran conflict, government shutdowns, and currency crises, Bitcoin has largely moved in tandem with risk assets, failing to protect investors during turmoil.
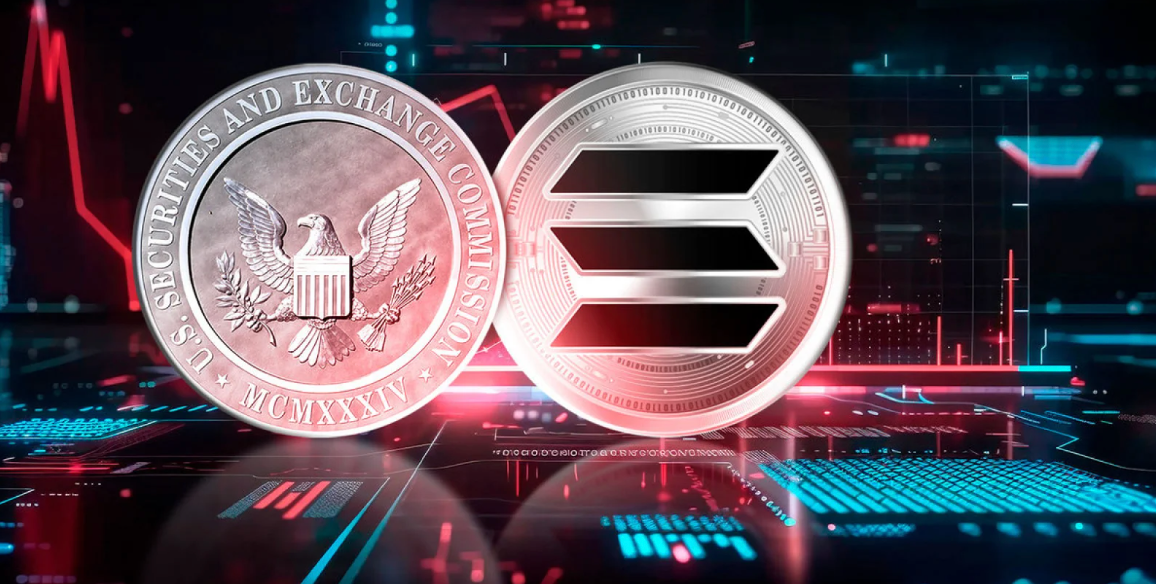
The imminent approval of Solana Spot ETFs will mark a major disruption in traditional markets. Setting the next crypto frontier, Solana is not just another token, it's ultra-fast, super cost effective and developer-friendly blockchain that powers a vast and growing ecosystem of real-world applications. From DeFi and tokenised payments to NFT platforms and Web3 gaming, Solana offers unmatched scalability and speed that rival traditional financial systems can't beat. Now its inclusion in ETF offerings signals a shift in regulatory momentum and investor appetite. Read on....

Desires are strong and dream last long. Mass-market brands sell us reality, whilst luxury brands have the incredible ability to sell us dreams. Through compelling storytelling, these brands ignite our immediate desires to imitate an ideal world that’s exclusive, successful, glamorous and prestigious which ultimately translates into our willingness to pay a premium for their products. Read on to find out the rationale behind this price phenomenon in the world of luxury.

Known for bear hugs, affection, smiles, and wisdom, grandparents are special. They tell the best stories, have the answers to everything, not to mention the candy treats. How can we embrace the power of AI technology to make sure that our Nan and Pop age happily in their golden years?
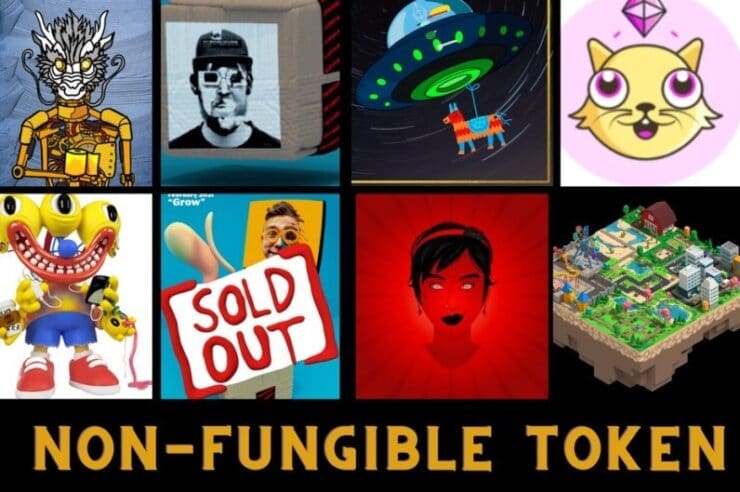
In the last few months, it has been near impossible to exist on the internet without noticing NFTs, the technology dominating the world of collectibles, art and gaming. In this month's post, I will bring you to the crazy, wild and expensive world of NFTs where millions and millions of dollars worth of NFTs have changed hands, but nothing makes any sense. In the relatively short history of the crypto world, from the ICO boom in 2017, the smart contract platform era in 2018, Stablecoin in 2019, DeFi craze in 2020, in 2021, the torch has passed on to NFTs. Is NFTs another 'Tulip Mania' - an enormous bubble waiting to pop? Is it just another crypto wave that just comes and goes, or is it a paradigm shift that is incredible and inevitable?

Are diamonds just 'girl's best friend'? This post explores the world of men's jewellery, from the lavish splendour in the Renaissance era and heavy metal in the world of rock 'n' roll to modern day fashion statement, an expression of style that embraces androgyny and individuality. The moment you say ‘men’s jewellery’, it’s not unusual to think high-wattage gold chains and enormous rings encrusted with too much diamonds that rappers wear.

Explore how the coronavirus pandemic has shaken up and transformed the billion-dollar industry. Gone are the days when international university students and Chinese aunties with hessian shopping trollies sweeping baby formulas off the shelves while frantically WeChatting their buyers in China to finalise the transaction, choking up almost every Chemist Warehouse store, making parents furious over baby formula shortages. Desperate mums like myself had to scour pharmacies, supermarkets, Kmart, Big W, eBay, Amazon, you name it, for a tin of organic infant formula for my baby boy. It was an ongoing struggle until the coronavirus pandemic hit our shores and government closing the border to all international travellers. Overnight, it upended inbound tourism and disrupted the entire Daigou ecosystem and the logistics network.